Most Hateful States in America
This commentary questions a common belief among many Americans that Southern states are more racist and bigoted than Northern states and Western states. In a highly unscientific survey conducted on adults and children here, I discovered that most of them believed that Southern states will have more hate crimes. They also believed that Republican states will spawn more hate crimes as compared to Democratic states. I myself thought the same way until I studied the 2016 hate crimes statistics.
As noted in a previous commentary, hate crimes are motivated by biases derived from race, ethnicity, religion, gender, sexual orientation, and disability. In 2016, the Uniform Crime Reporting Program reported 6,121 hate crimes involving more than 7,500 victims. Most hate crimes take the form of intimidation, physical assault, and property damage. Some hate crimes are heinous, including rape and murder.
More than 57% of hate crimes are motivated by race/ethnicity followed by 21 % hate crimes motivated by religion. African-Americans and Jews are the top targets for hate crimes. Whites and Muslims are the next top targets in race and religion categories respectively. Overall, White Christians are the chief perpetrators of hate crimes.
States Statistics
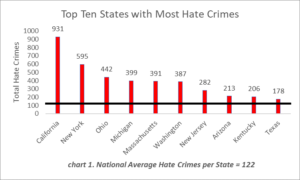
Chart 1 shows the top ten states where most hate crimes are reported in 2016. California leads the pack of 50 jurisdictions, including the District of Columbia (Hawaii does not participate in data collection). The national average of hate crimes per jurisdiction is 122. Virginia sits exactly on the average. Thirty- seven jurisdictions have reported less than 122 hate crimes. Thirteen jurisdictions report hate crimes above the national average.
With a total of 931 hate crimes, California leads the nation; its hate crime rate is more than seven times the average. Texas stands at the 10th place with 178 hate crimes. The other eight states with the most hate crimes reported in 2016 are New York, Ohio, Michigan, Massachusetts, Washington, New Jersey, Arizona, and Kentucky.
charts prepared by legal scholar academy
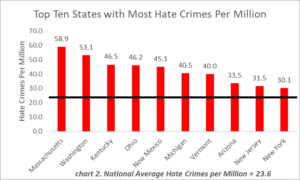
Statistically, there is a sounder way to understand the distribution of hate crimes. Chart 2 offers an analysis of hate crimes by factoring in the population of the state. The likelihood that there will be more hate crimes in a highly populated state is obvious, though not inevitable. As demonstrated in Chart 2, the population-proportionate (PP) analysis draws a somewhat different picture of states with the most hate crimes. The PP analysis identifies Massachusetts, Washington, Kentucky, Ohio, New Mexico, Michigan, Vermont, Arizona, New Jersey, and New York as the top ten states. (The District of Columbia is excluded from this list, though it has the most crimes (169) per million). Nationally, the average hate crimes per million are 23.6. Massachusetts leads the nation with nearly 59 hate crimes per million. Note that California and Texas do not make the top-ten PP chart.
Political Analysis
Under gross numbers, one may (erroneously) conclude that the probability of experiencing a hate crime in California or New York is higher than in Massachusetts. In fact, the probability of experiencing a hate crime in Massachusetts is much greater than in California or New York because the per million hate crimes in Massachusetts are way higher than in California or New York.
Unfortunately, Massachusetts, the home of liberalism and grand institutions including Harvard University and MIT, is the most hateful state in the nation. By contrast, Texas, notorious for its bigotry sponsored by politicians like Ted Cruz, is one of the least hateful states given its massive population (27.8 million). Under the PP analysis, Texas has only 6.4 hate crimes per million as compared to 58.9 hate crimes per million for Massachusetts. The Texas number is “shockingly” below the national average of 23.6 hate crimes per million.
Defying the general prejudice against the South, the Southern states do not dominate the hate crimes charts. Only Kentucky makes the top ten. It is surprising to see liberal Vermont (95% white), but not conservative Alabama (68% white), in the top ten. Arizona is not a shock, given the hatred displayed against immigrants and the presence of hate provocateurs such as Joseph Arpaio.
The PP numbers also disprove a common prejudice that Red states generate more hate crimes than Blue states. Out of the top ten in the PP chart, six states (Massachusetts, Washington, New York, New Jersey, Vermont, and New Mexico) voted democratic in the 2016 presidential election. True, the hate crimes statistics do not identify whether the perpetrators of hate crimes are, or voted for, Republicans or Democrats. Yet, a statistically justifiable conjecture can be made that Democrats in Blue states commit a significant percentage of hate crimes.
Conclusion
The American Left is justly skeptical of the will and ability of both Republicans and Democrats in solving the so-called law and order problems, such as hate crimes. Many Republican leaders, including President Trump, stoke racism and other forms of bigotry that spill over state borders. Democrats talk a big game. And yet Democratic Massachusetts tops the list of hate crimes per million while Democratic California hosts the most hate crimes. Six Blue states occupy the PP chart while an equal number of Blue and Red states share the gross numbers chart. In each hate crimes chart, the top two states are predominantly Democrats. Furthermore, more Northern states than Southern states make the top-ten list of hate crimes.
The Democratic Party and the New England political elites project themselves to be more protective of racial, religious, and other minorities. The hate crimes statistics do not support their claims in their own states. The top ten states, particularly Massachusetts and Washington, must face their hate crimes statistics to figure out whether they can reestablish a political and legal culture that deters hate crimes.